最简单的自定义监控项
1
2
3
4
5
6
7
8
9
10
11
12
13
14
15
16
17
18
19
|
/etc/zabbix/zabbix_agent2.conf
/etc/zabbix/zabbix_agent2.d/*.conf
vim /etc/zabbix/zabbix_agent2.d/custom_monitor.conf
UserParameter=<key>,<command>
UserParameter=<key[*]>,<command $1 $2 ...>
<key>:监控项键值
<command>:要执行的命令或脚本
[*]:表示接受参数(方括号内可以自定义格式)
$1, $2, $3...:对应传递的参数位置
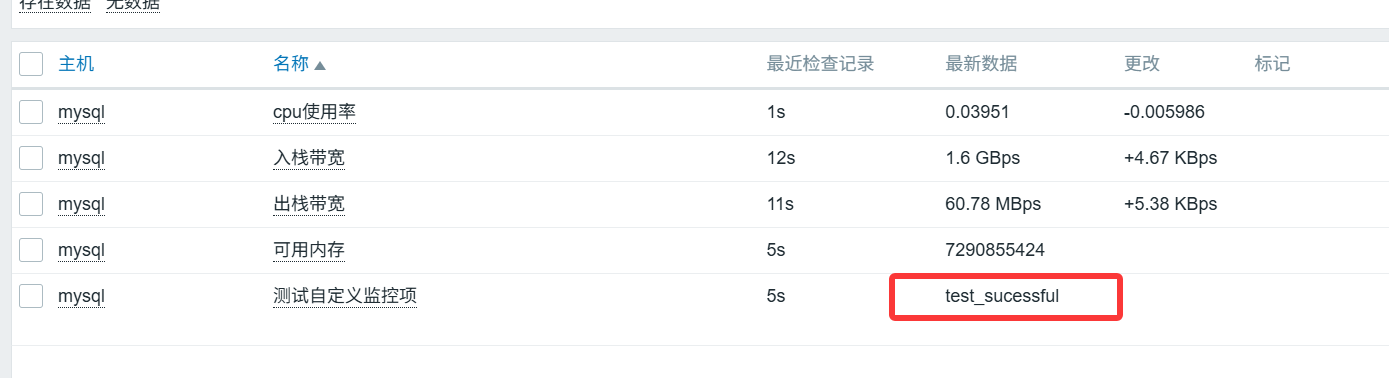
cat /etc/zabbix/zabbix_agent2.d/custom_monitor.conf
UserParameter=<test_key>,<echo "test_sucessful">
|
使用shell脚本自定义监控项
1
2
3
4
5
6
7
8
9
10
11
12
13
14
15
16
17
18
19
|
cat > /etc/zabbix/scripts/get_mem_cpu.sh <<EOF
#!/bin/bash
# 内存使用率
mem=$(free | awk '/Mem/{printf "%.1f", $3/$2*100}')
# CPU使用率(使用mpstat如果可用,否则用vmstat)
cpu=$(top -bn1 | grep "Cpu(s)" | awk '{print $2}' | cut -d'%' -f1)
echo "${mem}"
echo "${cpu}"
EOF
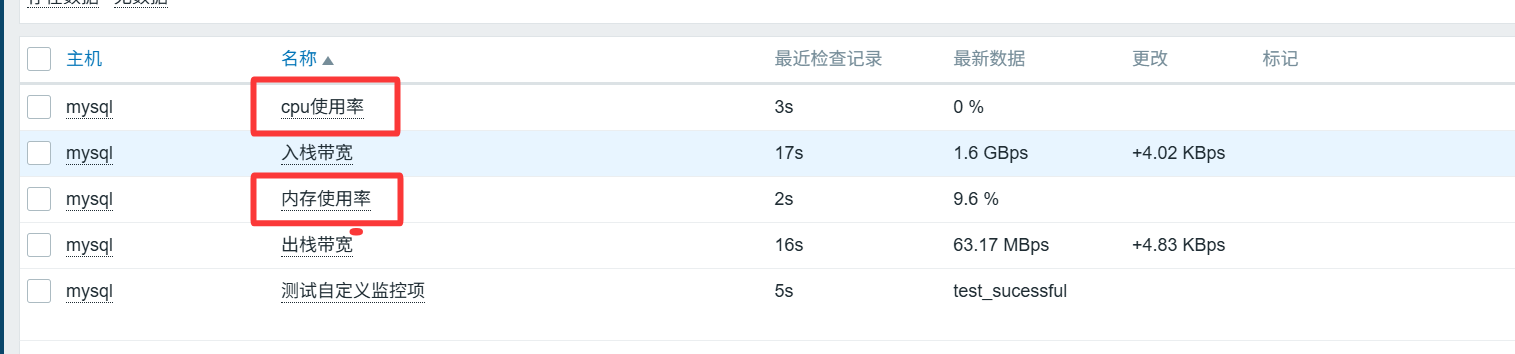
cat /etc/zabbix/zabbix_agent2.d/custom_monitor.conf
UserParameter=test_key,echo "test_sucessful"
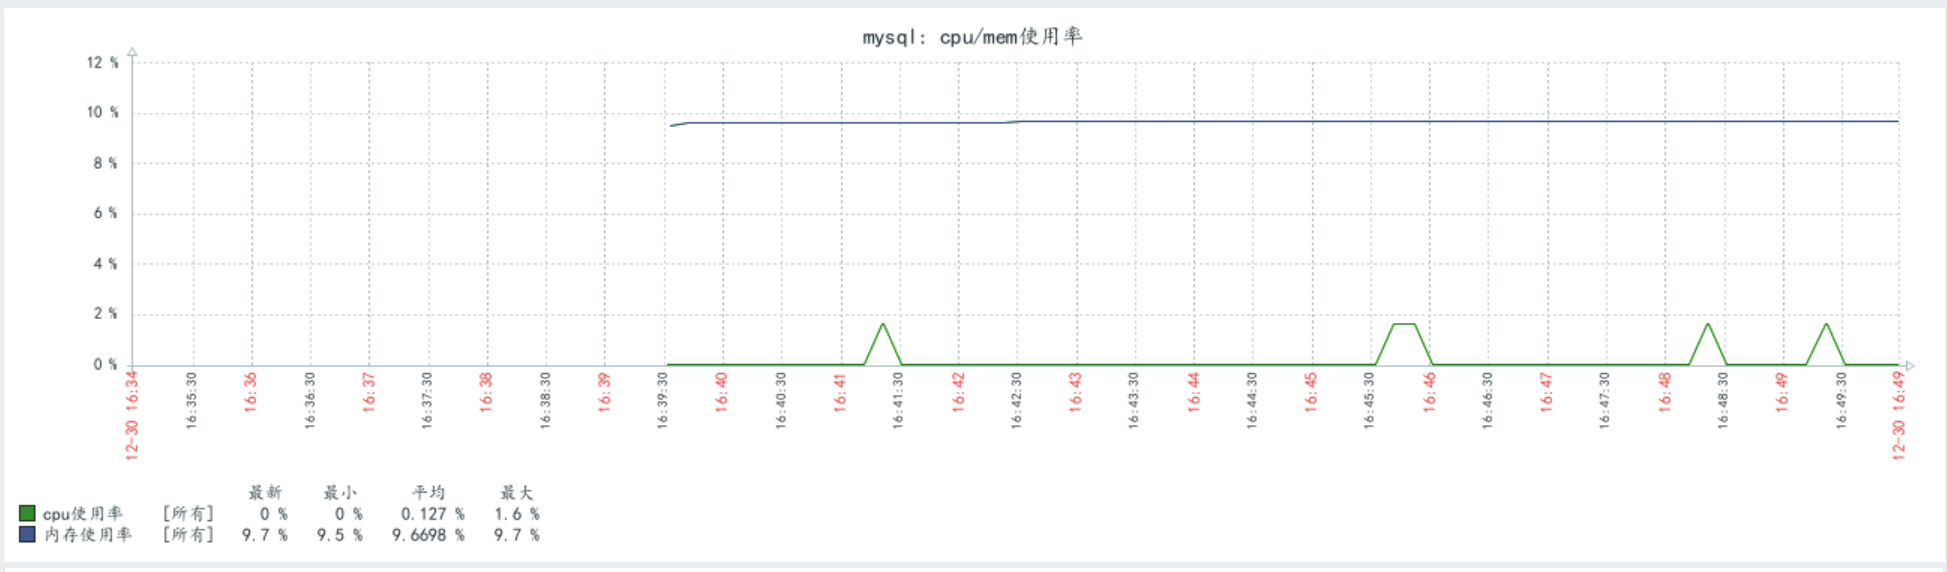
UserParameter=system.cpu.usage,/etc/zabbix/scripts/get_mem_cpu.sh | tail -1
UserParameter=system.mem.usage,/etc/zabbix/scripts/get_mem_cpu.sh | head -1
|

部署Grafana与添加数据源
1
2
3
4
5
6
7
8
9
10
11
12
13
14
15
16
|
docker run -d --name grafana \
-p 3000:3000 \
-e "GF_INSTALL_PLUGINS=alexanderzobnin-zabbix-app" \
grafana/grafana:10.4.3
https://grafana.com/grafana/plugins/all-plugins/
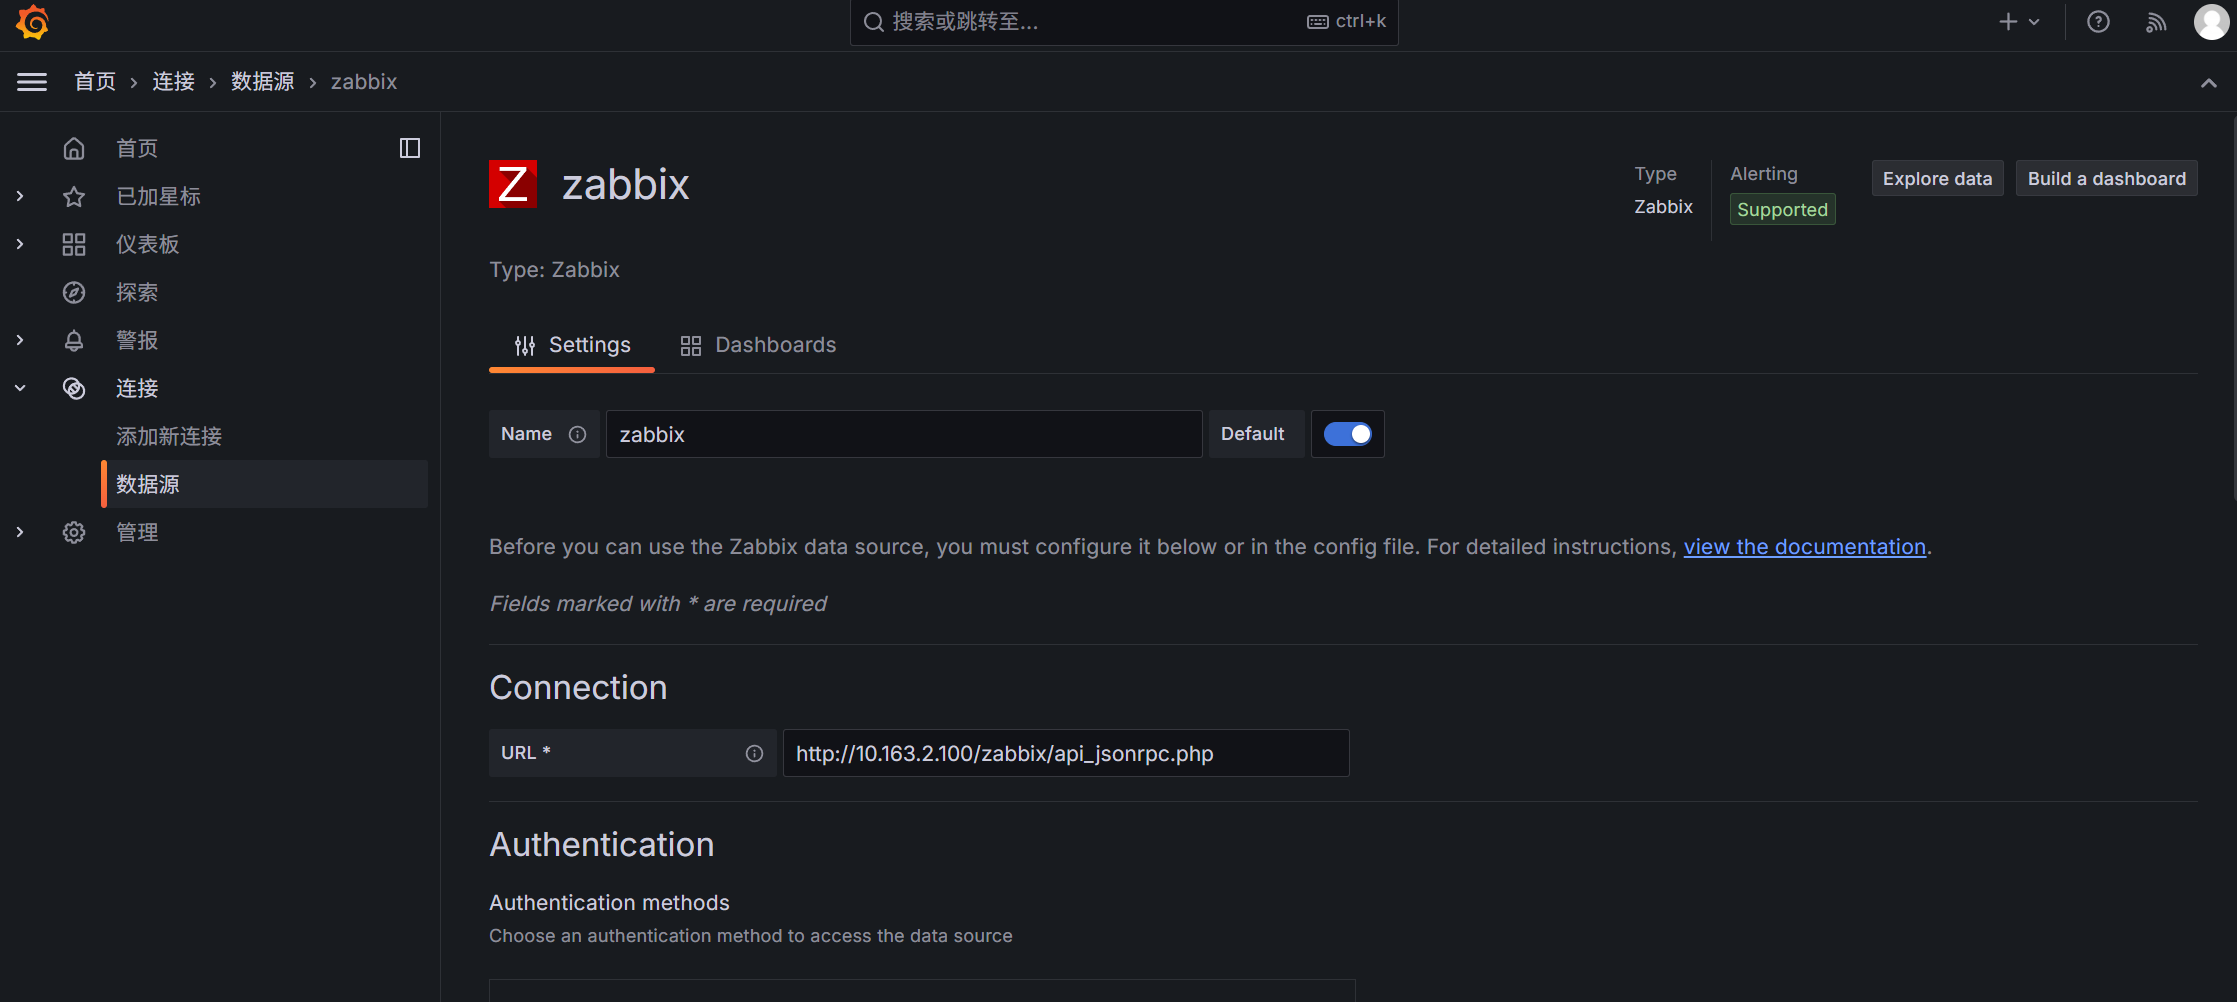
默认用户名密码admin/admin
|

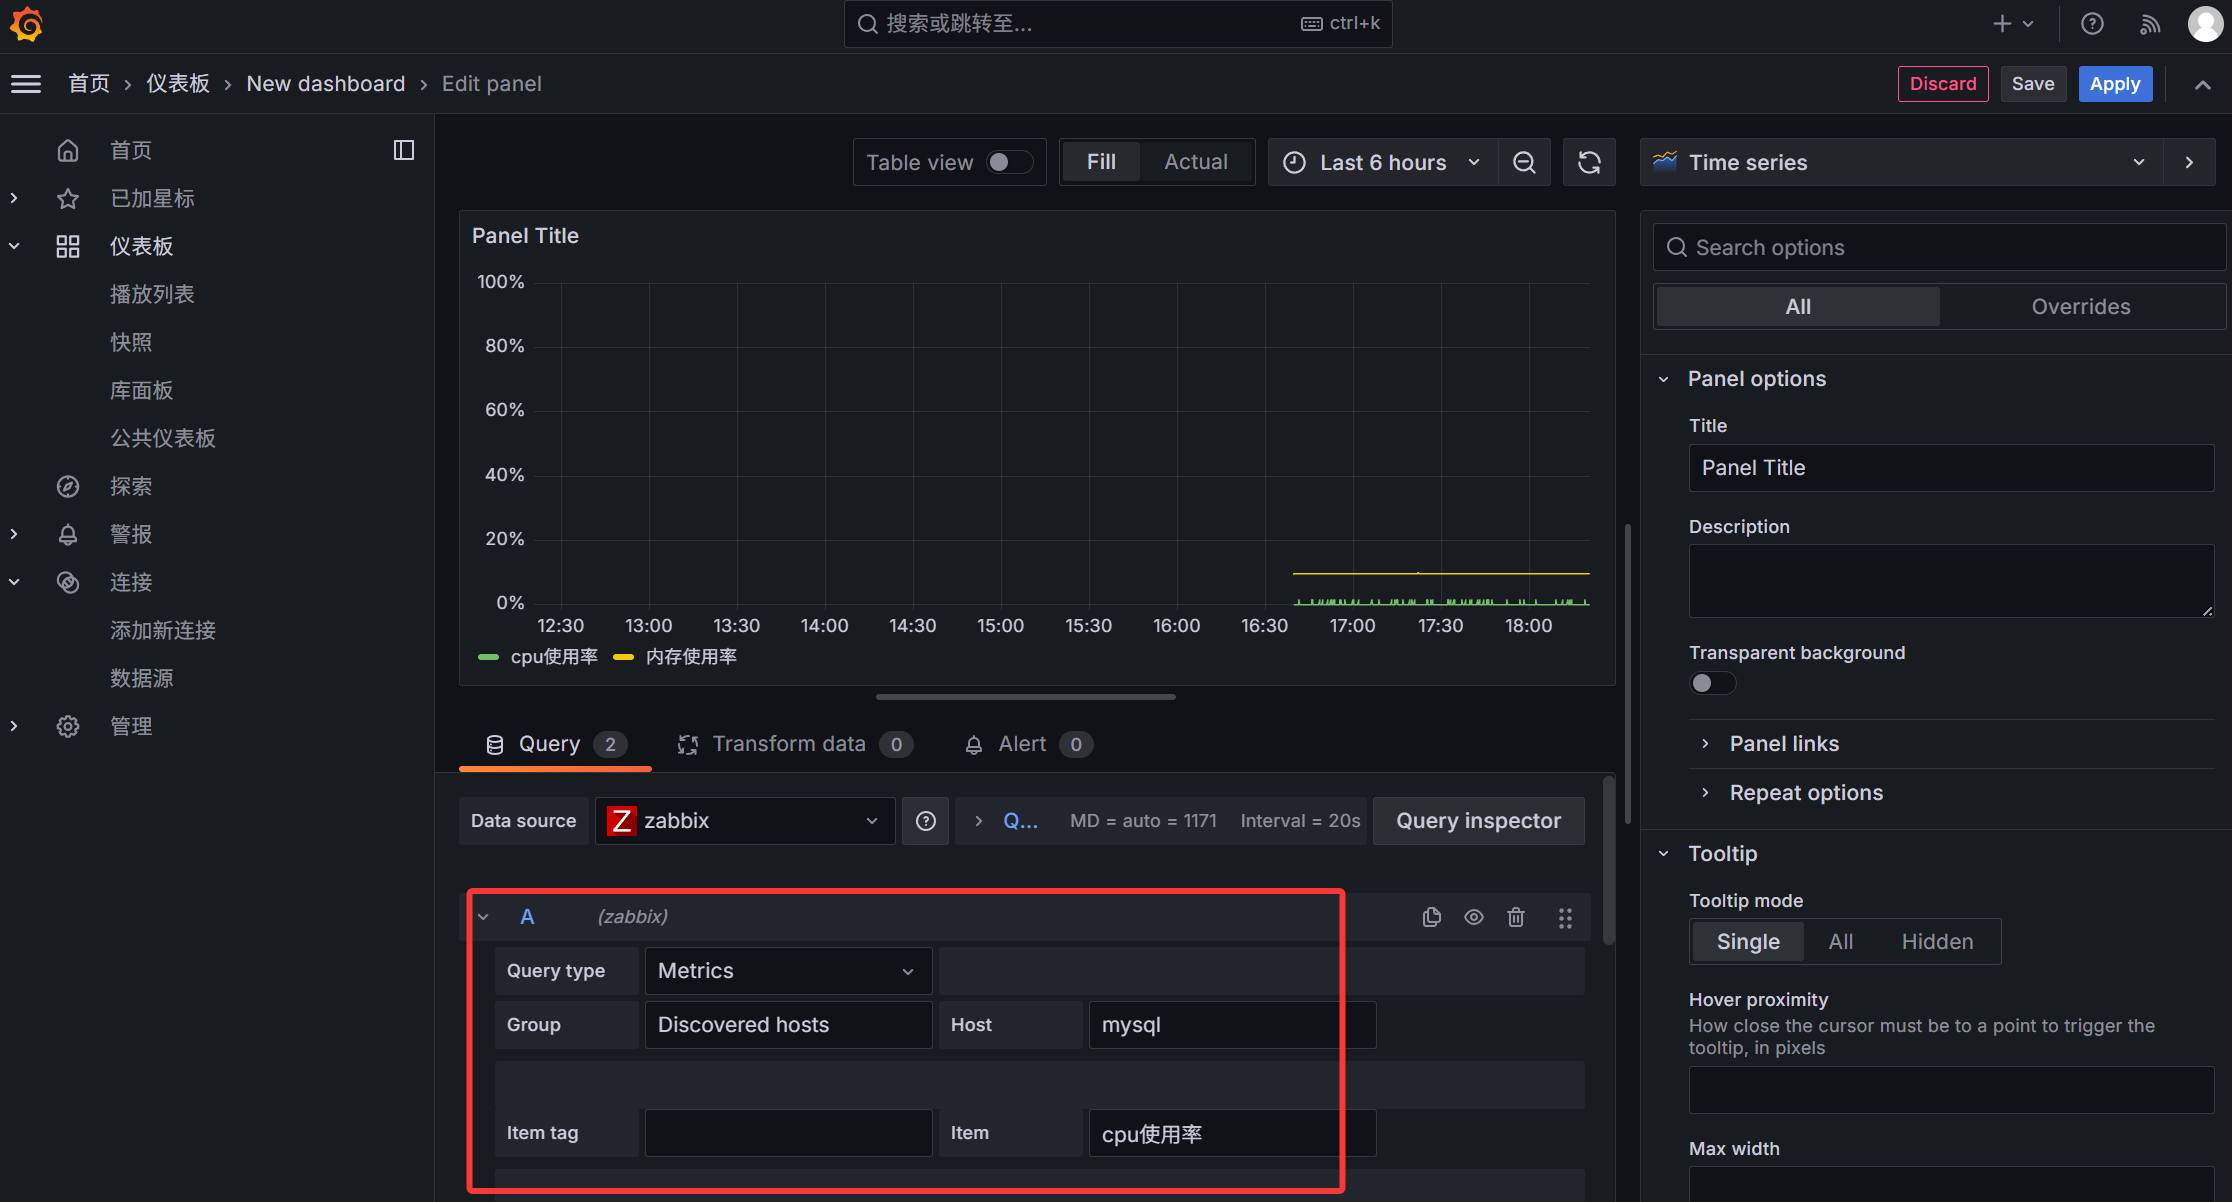
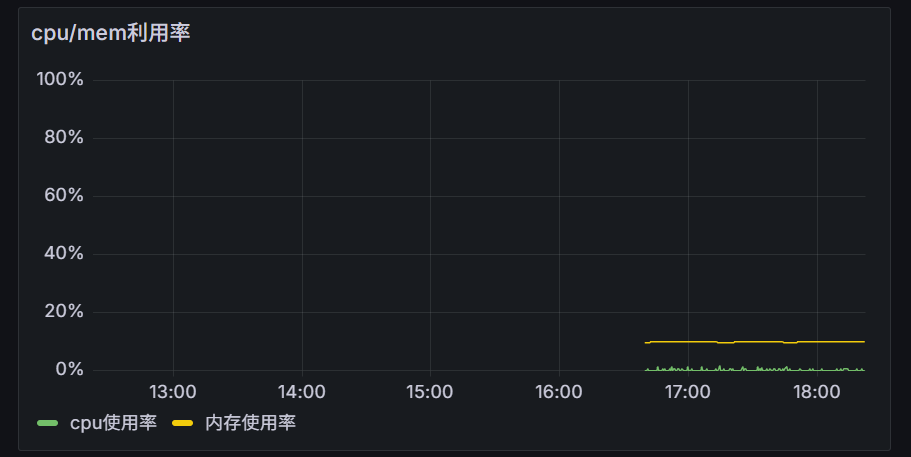
添加仪表盘(dashboard)